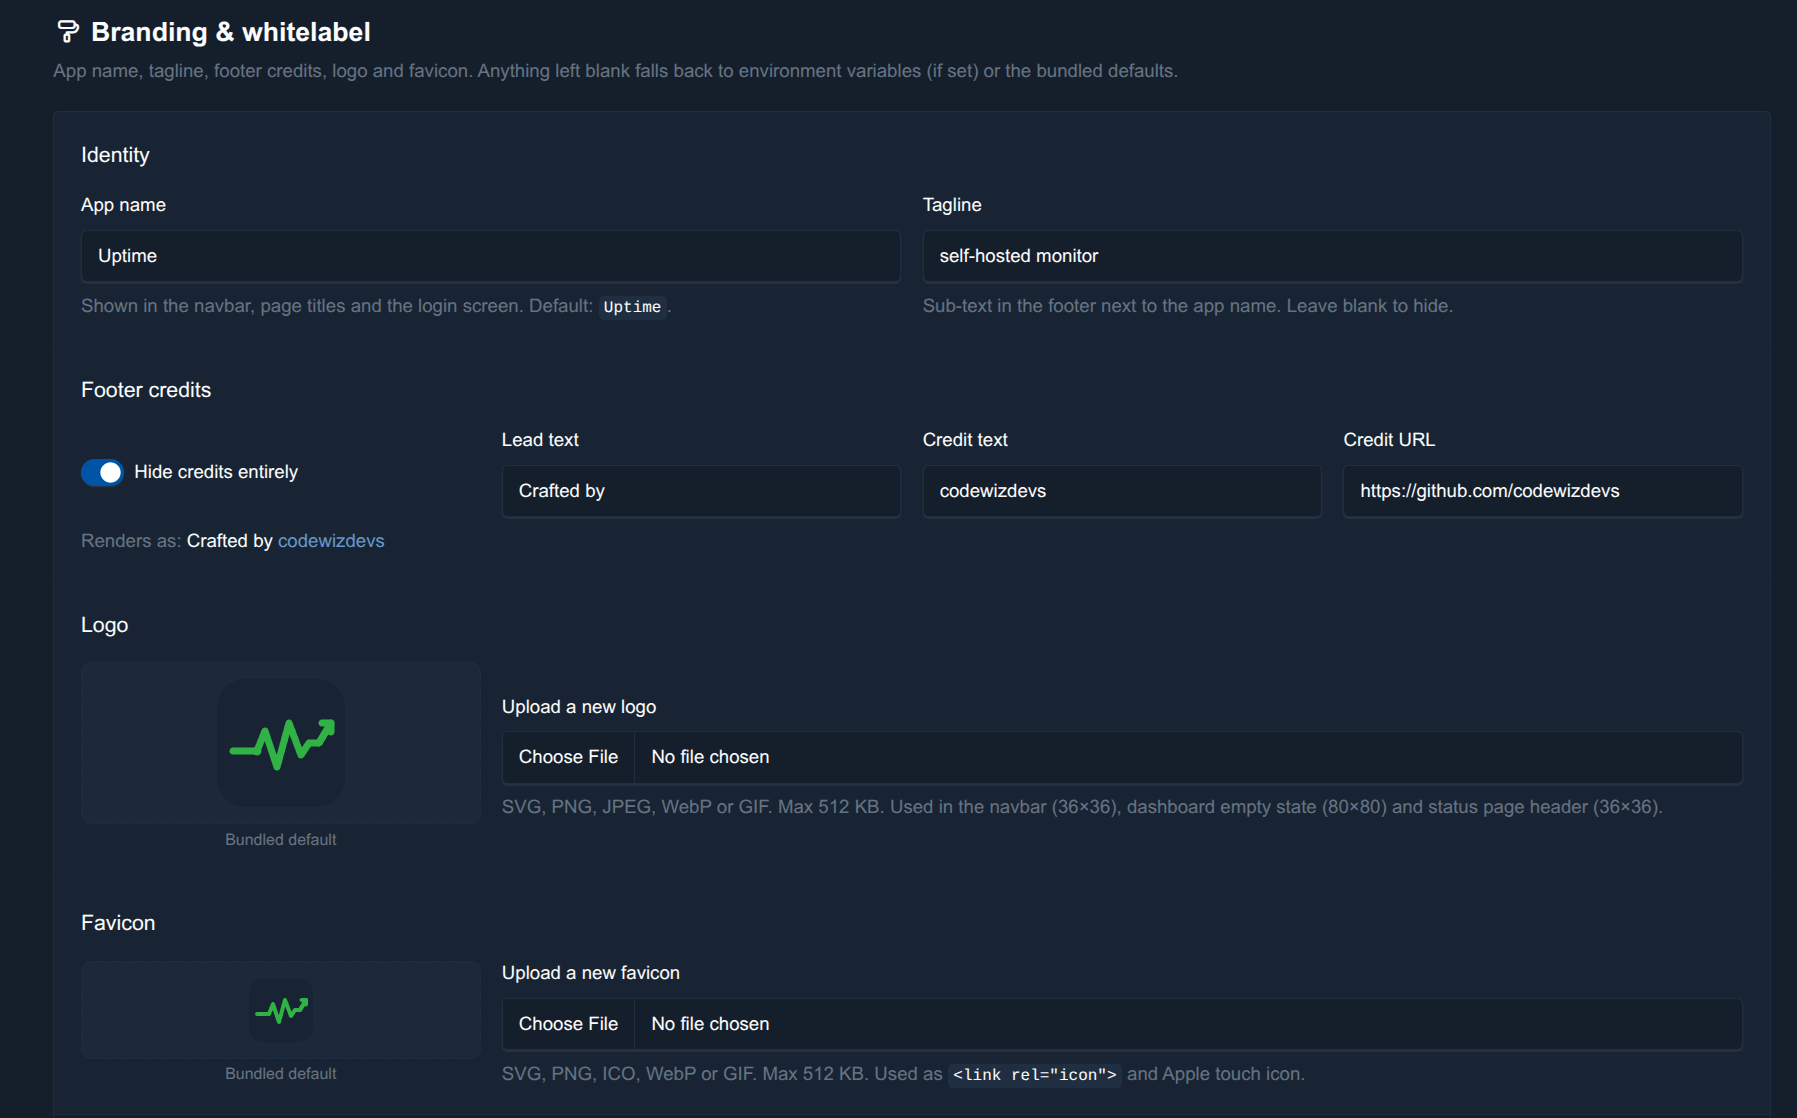
Cloudflare-aware probing
Detects Cloudflare challenges, records them as inconclusive instead of DOWN, adapts back-off, rotates realistic browser user-agents. The feature no other open-source uptime monitor ships out of the box.
One Express + EJS app, SQLite (or MySQL), zero build step. Monitor HTTP, TCP, ICMP, DNS, TLS certificates, domain WHOIS / RDAP expiry, and passive heartbeats. Alert through 10 channels. Share monitors with per-monitor ACLs. A lightweight alternative to Uptime Kuma, Healthchecks.io, Gatus, Statping, and Better Stack.
Probe anything you can reach, alert anywhere you operate, share with anyone on the team.
Detects Cloudflare challenges, records them as inconclusive instead of DOWN, adapts back-off, rotates realistic browser user-agents. The feature no other open-source uptime monitor ships out of the box.
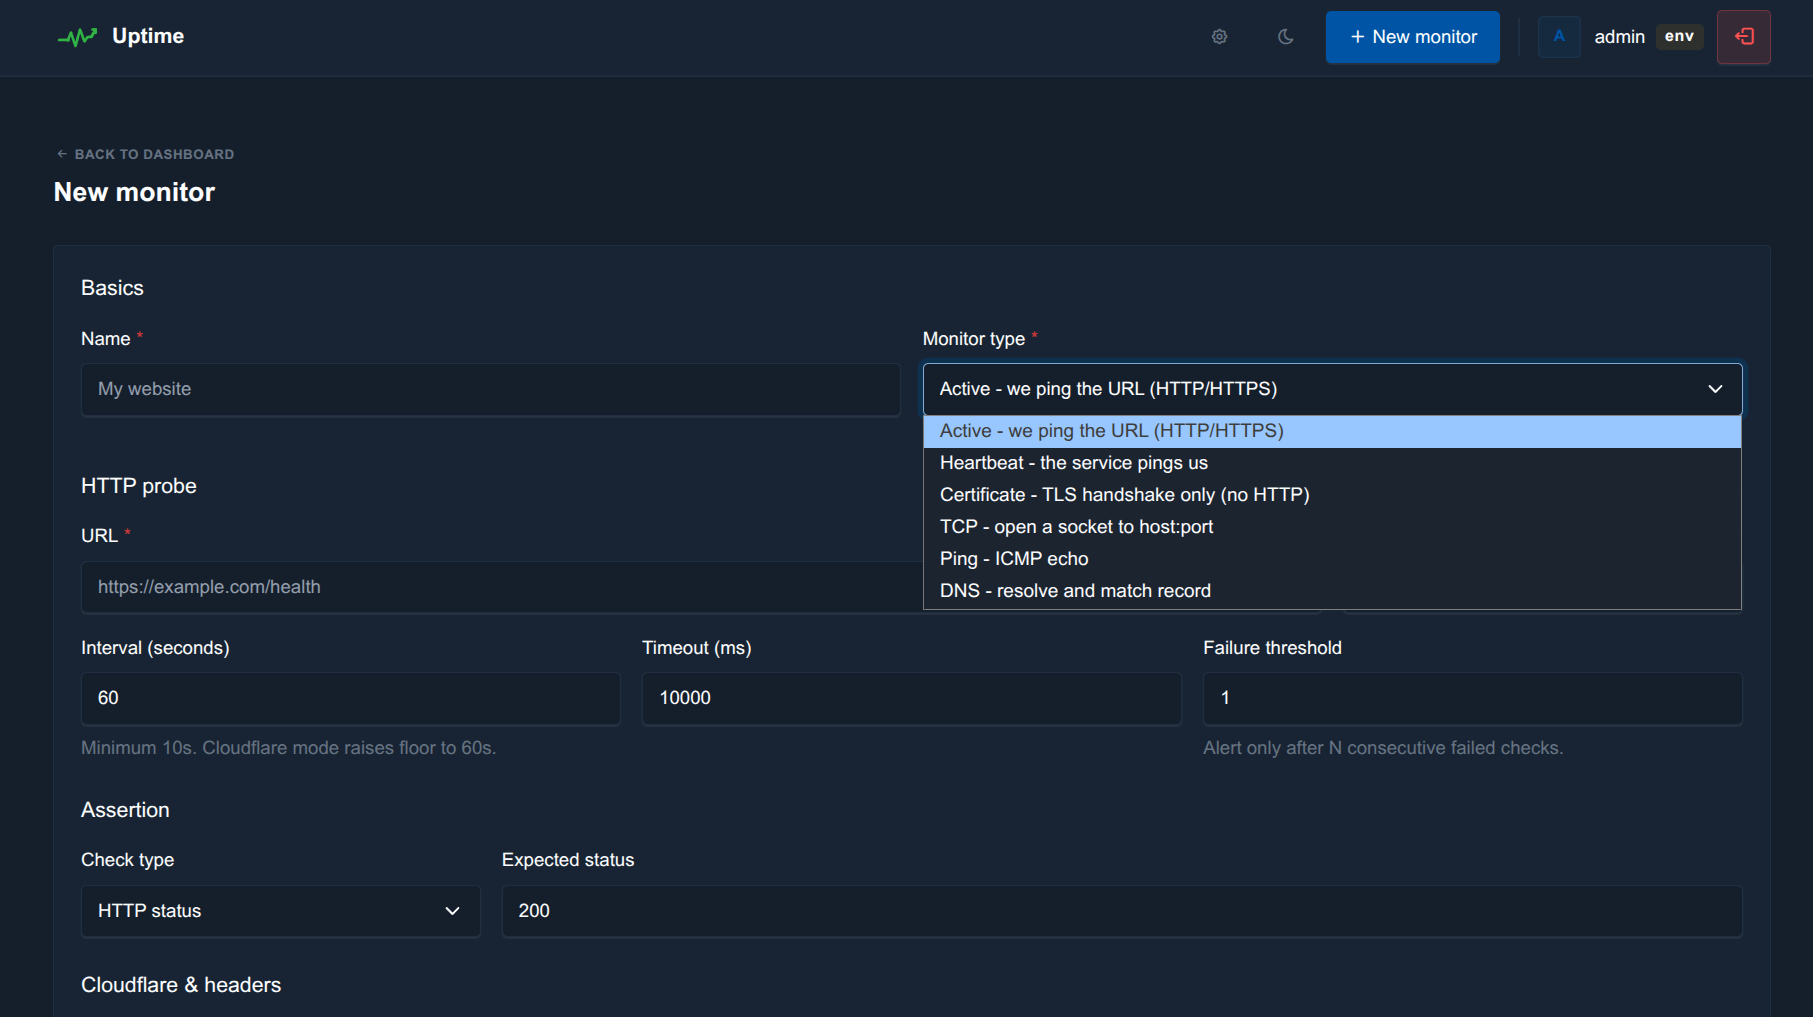
HTTP / HTTPS with regex, JSON-path, body-string, and status-code assertions. TCP, ICMP ping, DNS records, TLS cert expiry, domain WHOIS / RDAP expiry, and passive heartbeats (Healthchecks.io-style with start / success / fail pings and cron schedules).
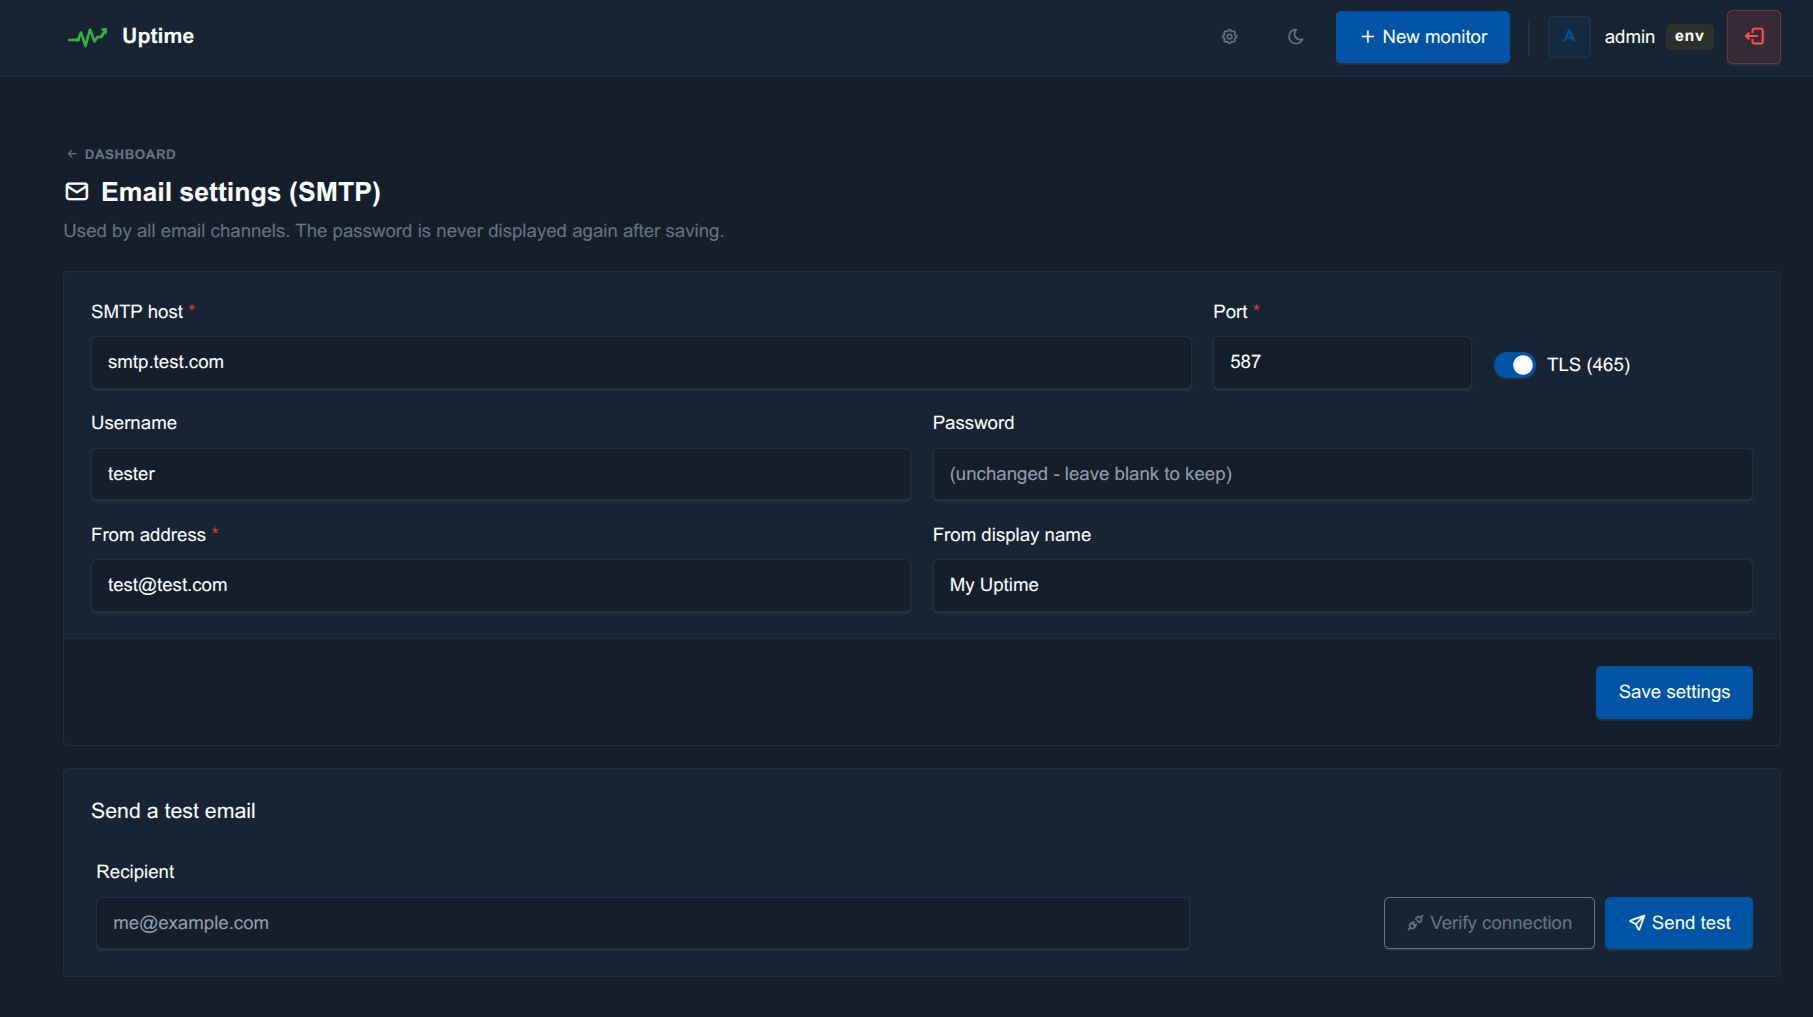
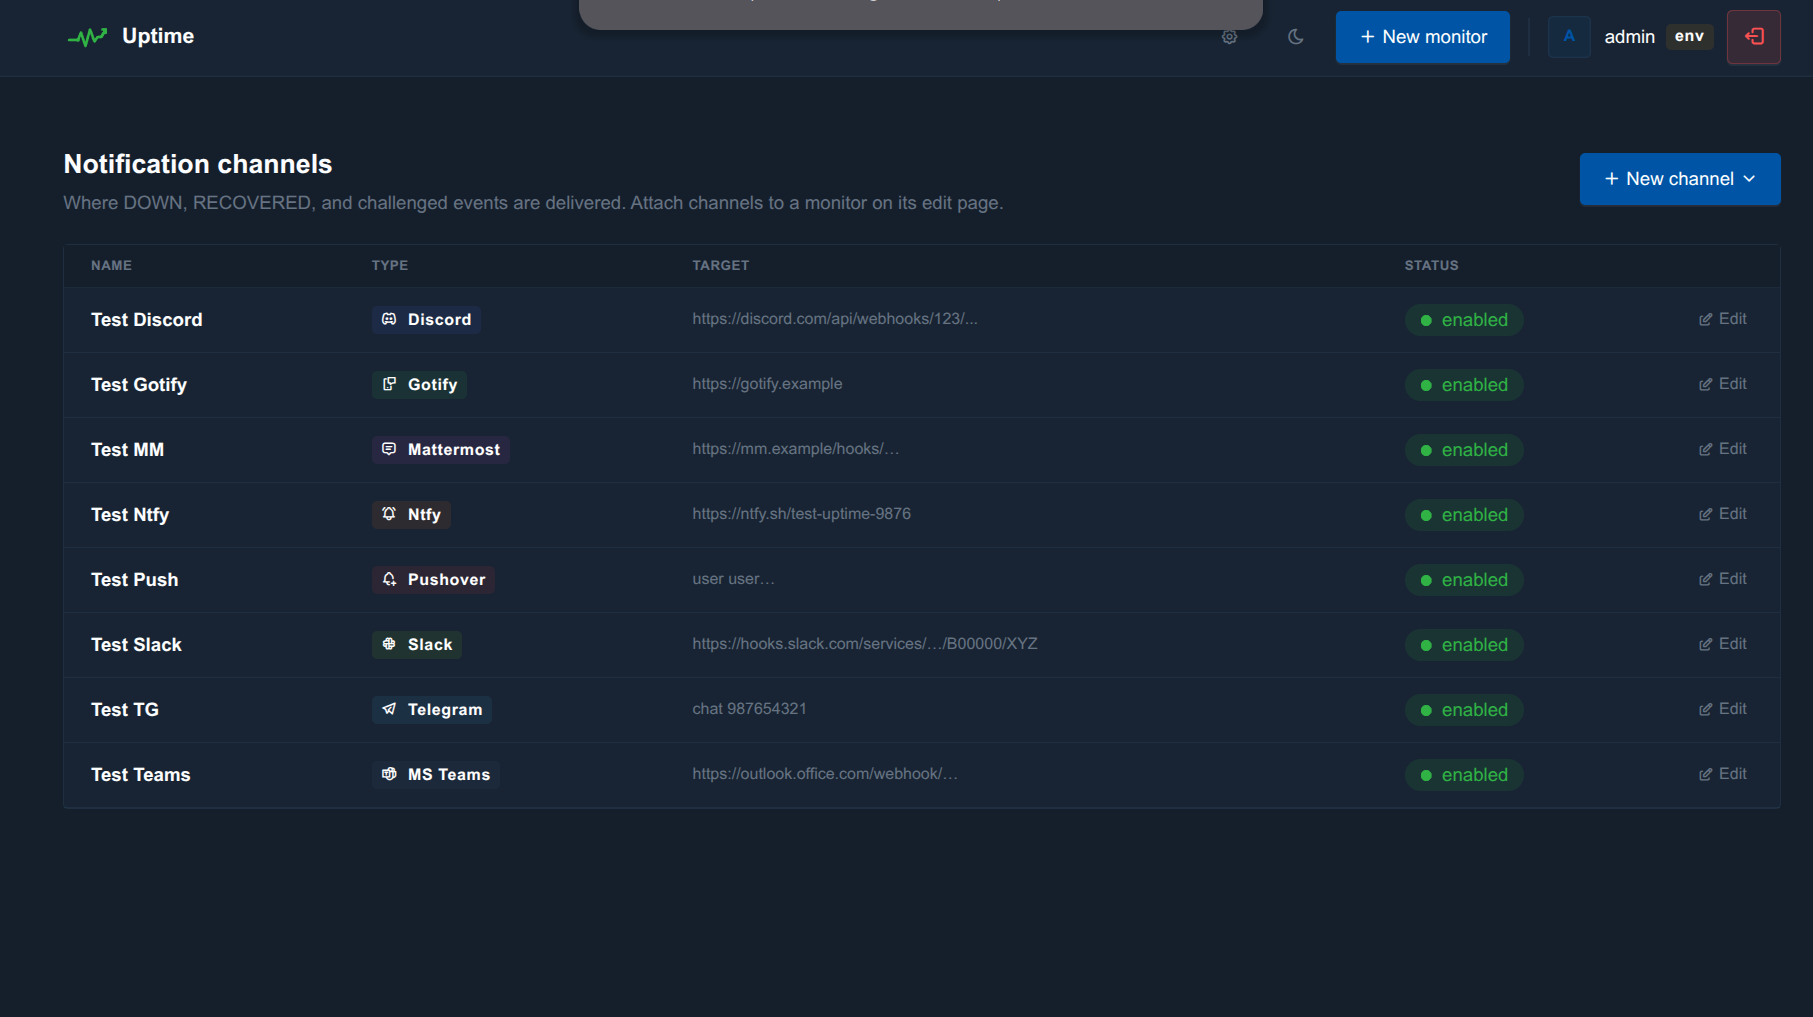
Discord, Slack, Telegram, Ntfy.sh, Gotify, Pushover, Mattermost, Microsoft Teams, SMTP email, generic webhook. Per-event message templates with placeholders and one-click reset-to-default.
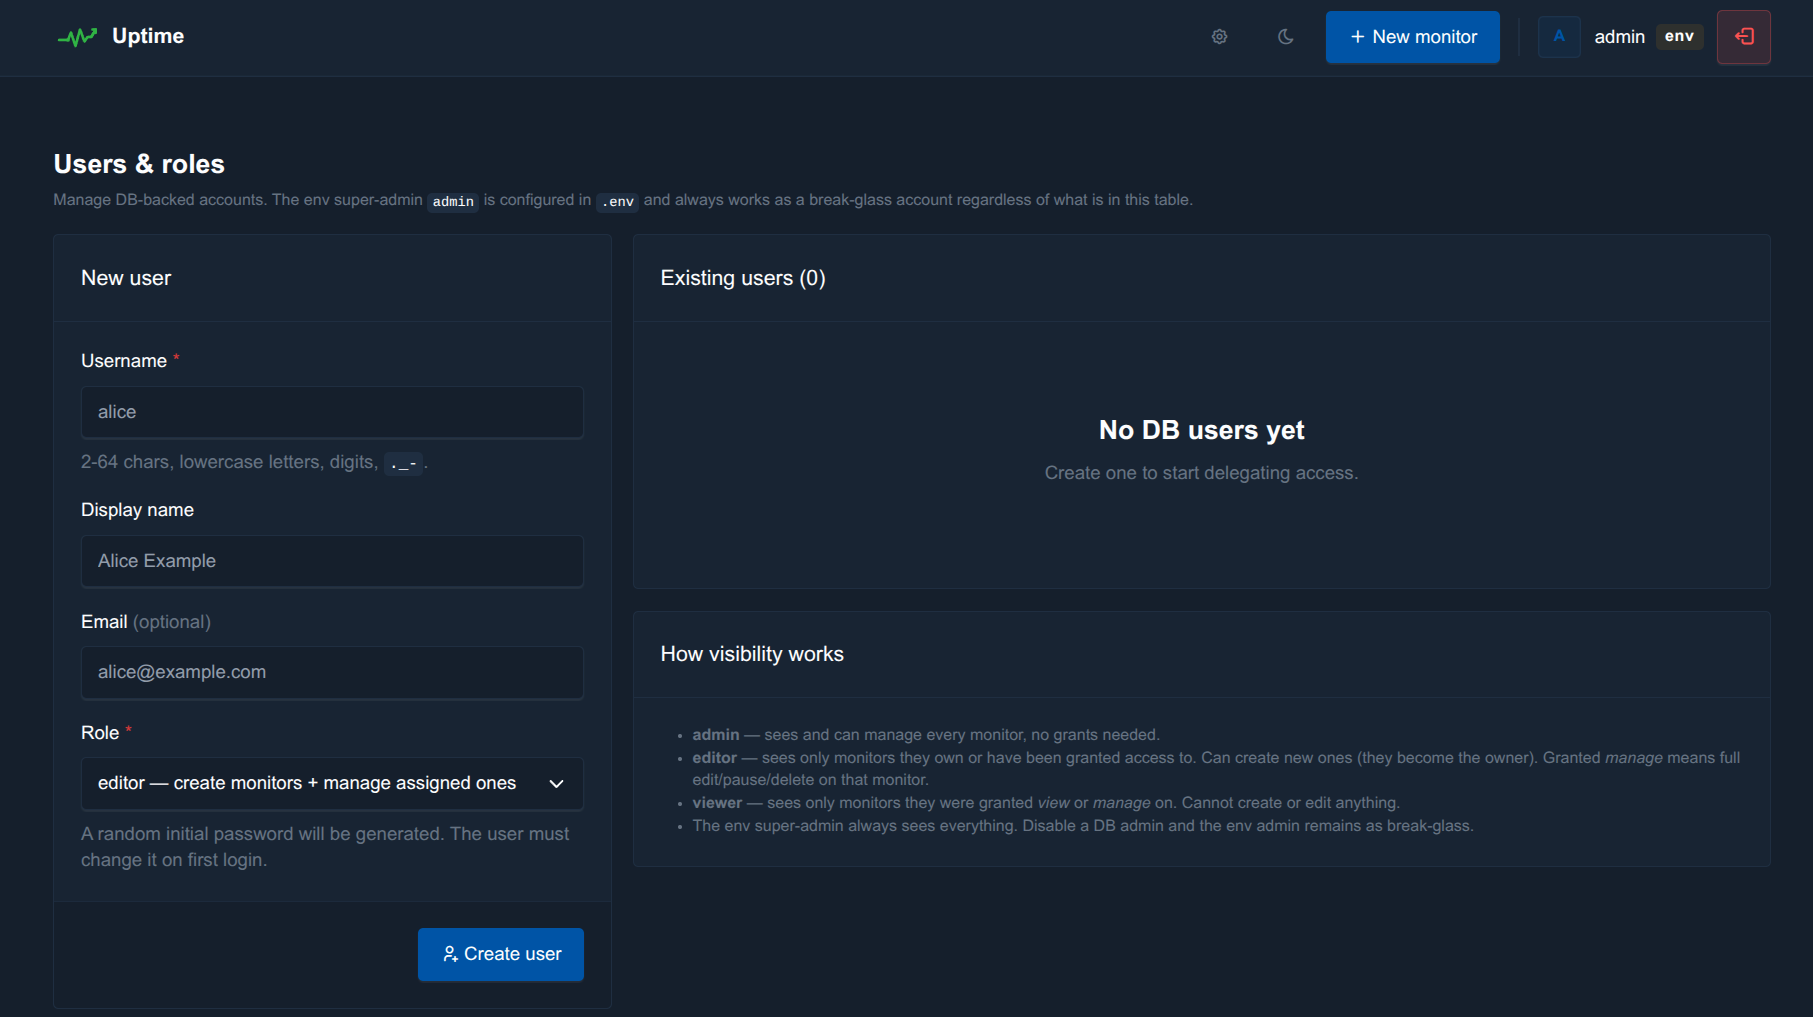
Flat admin / editor / viewer roles layered with per-monitor view / manage grants. Argon2id password hashing, per-user TOTP 2FA, personal API tokens — all backed by an env super-admin break-glass account.
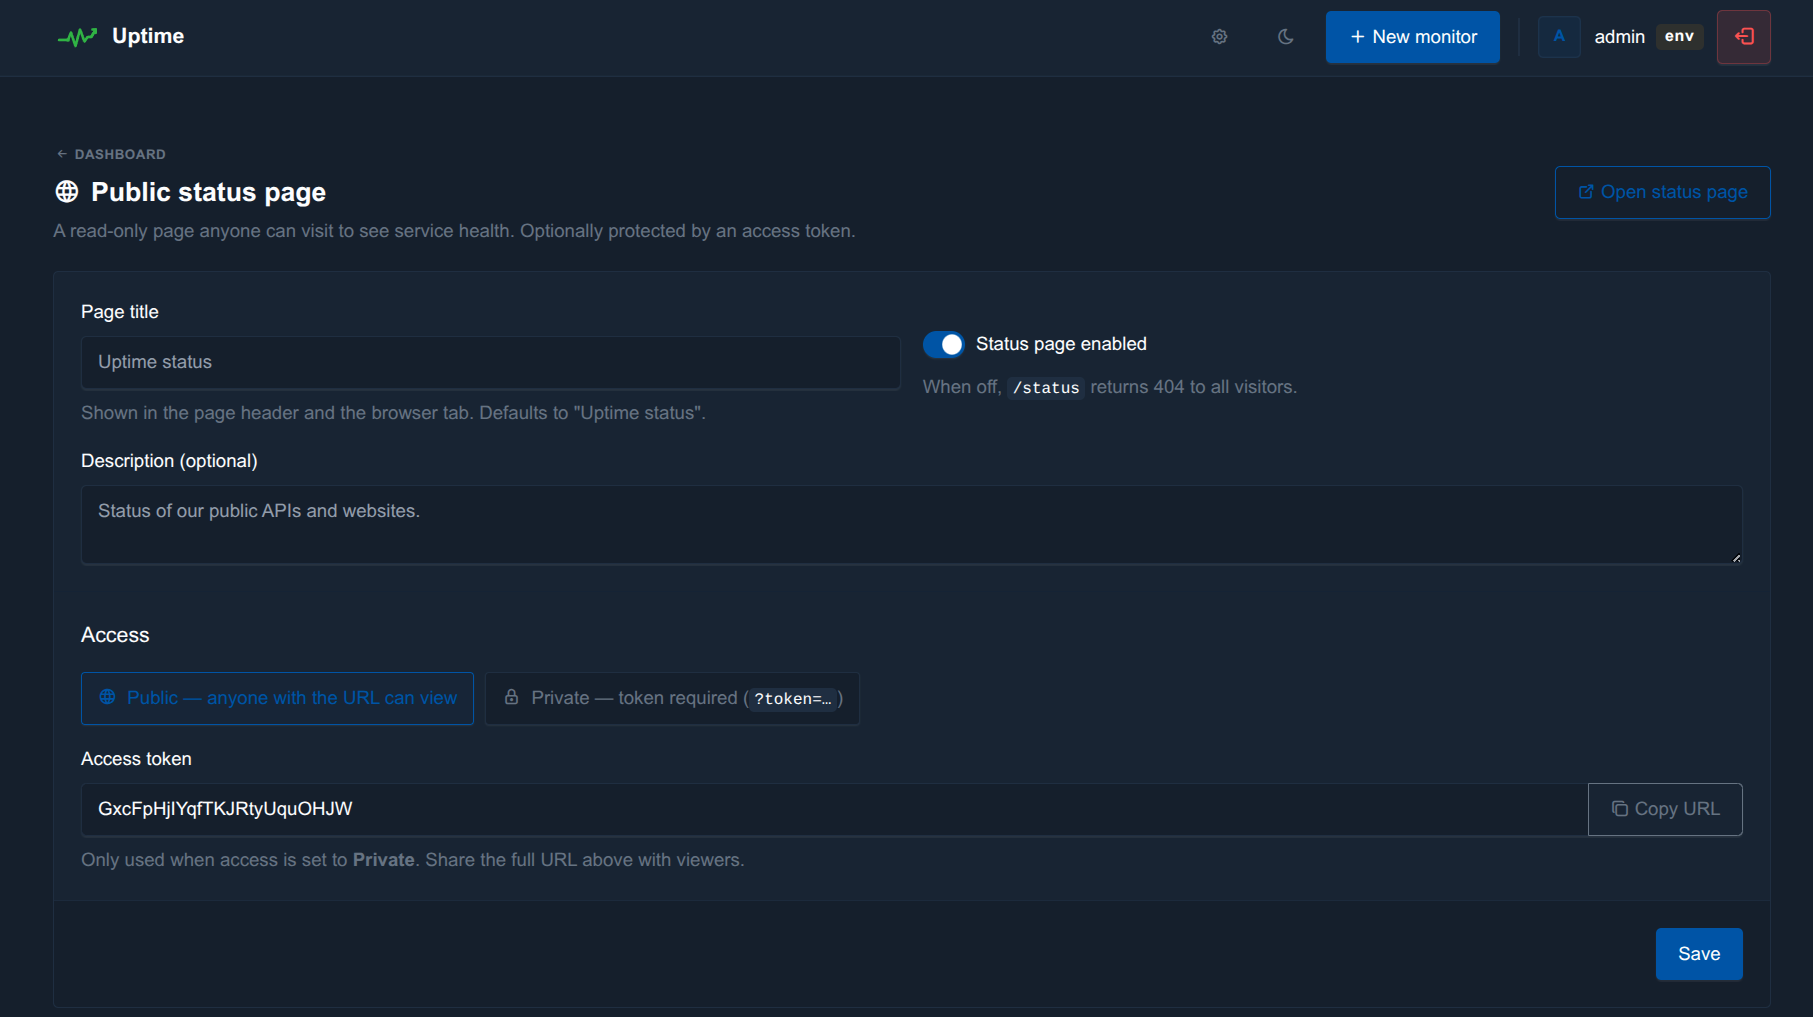
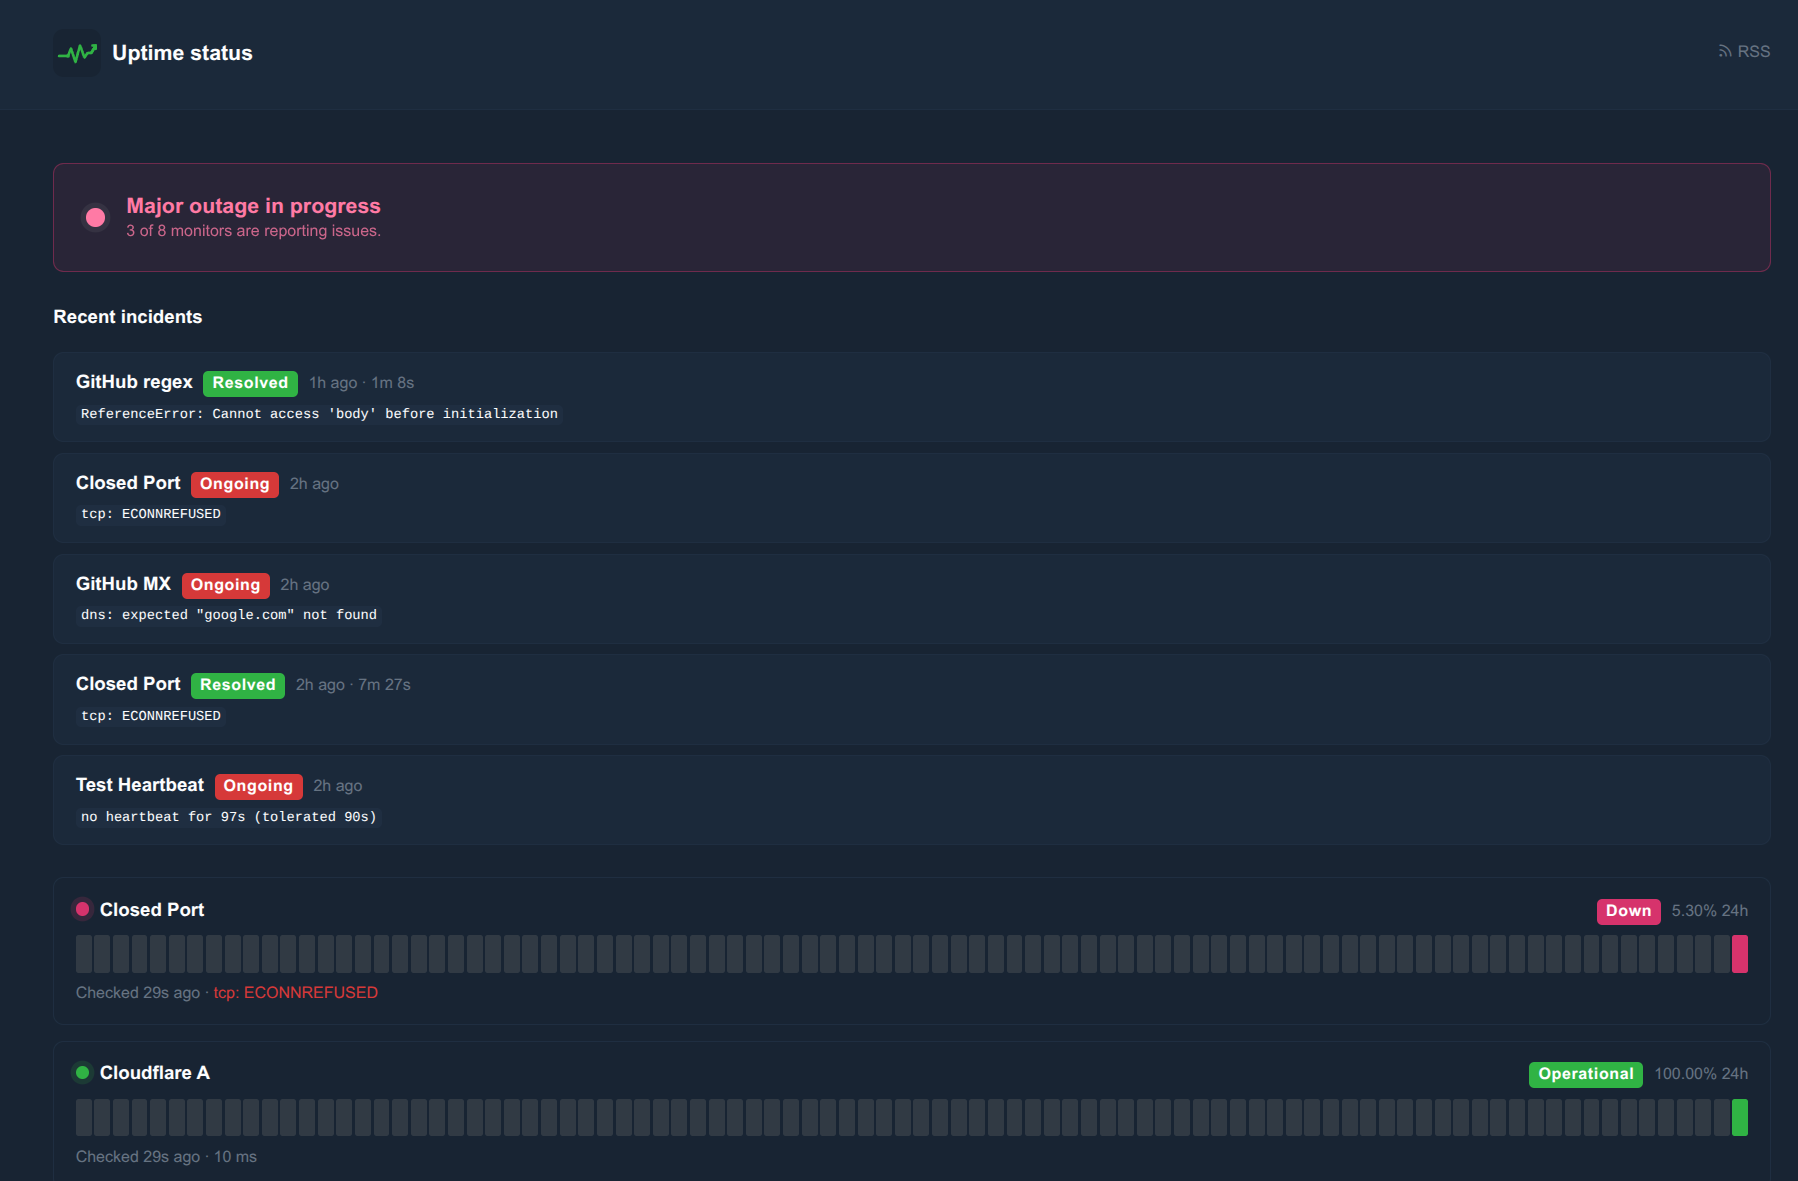
/status route (token-gated optional) with 90-day daily uptime bars, ordered monitor groups, per-monitor display-name overrides, last-24h MTTR, and an Atom feed at /status.rss.
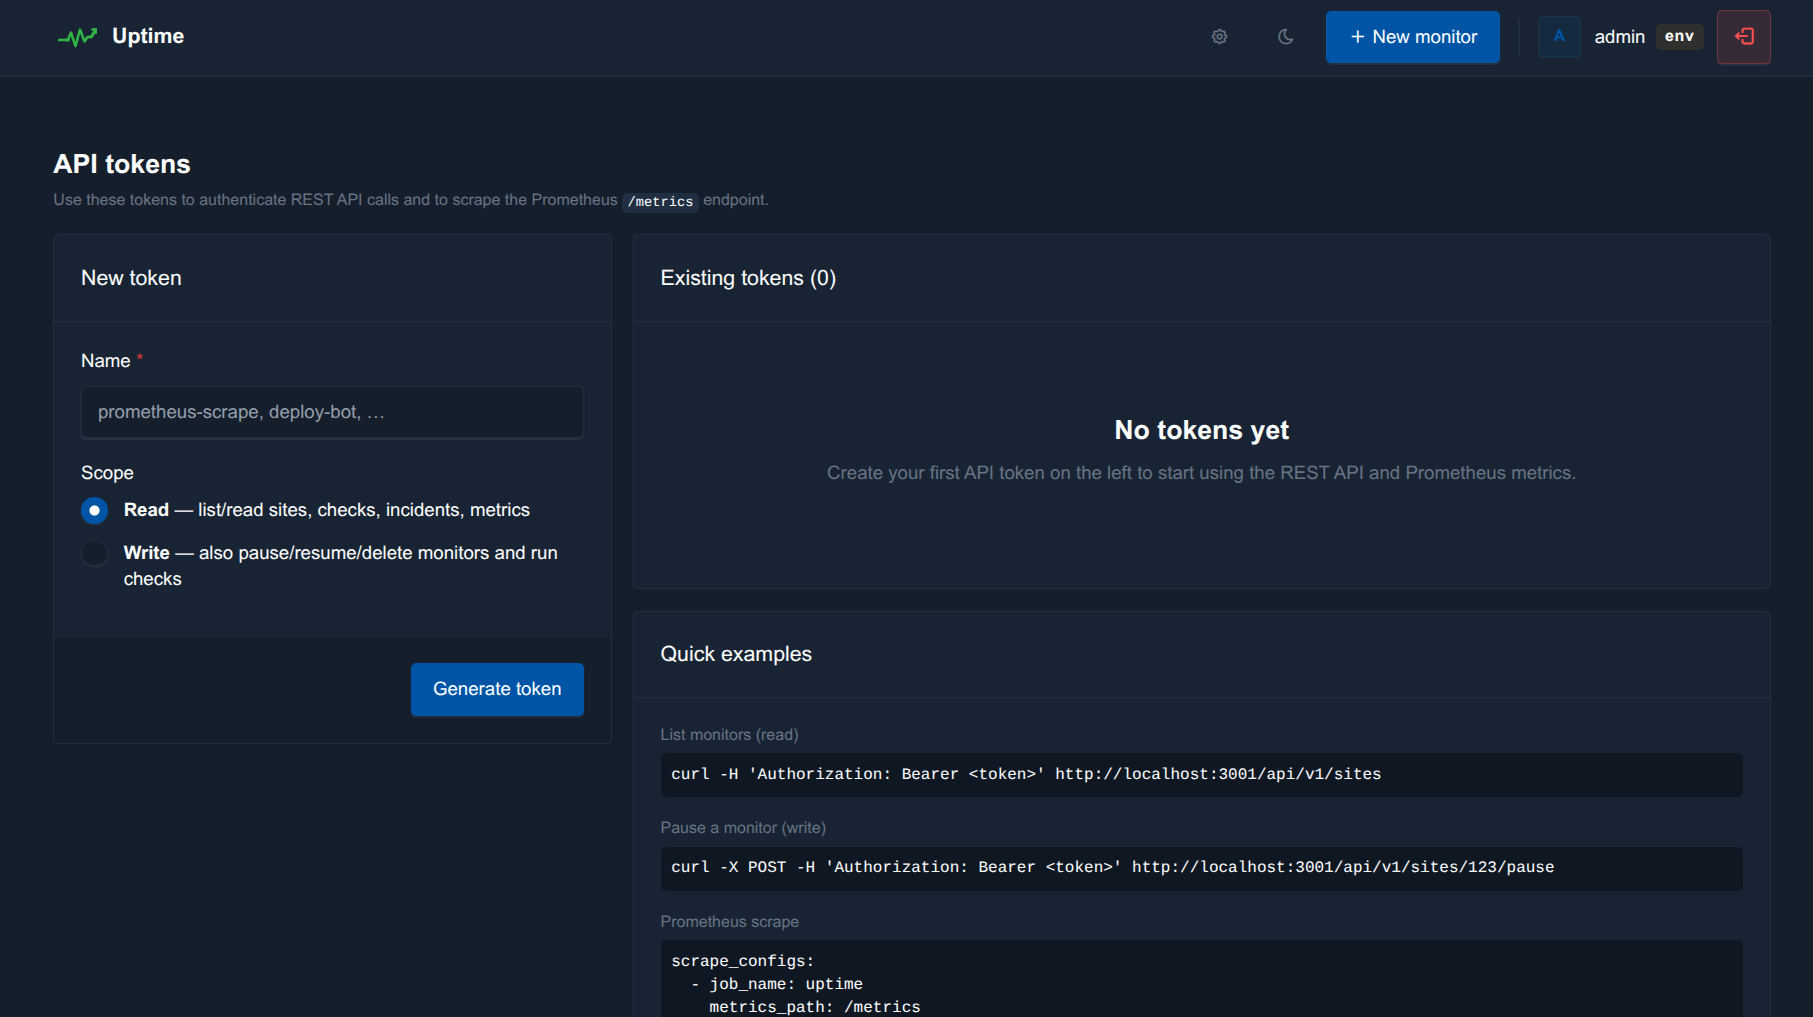
Token-authenticated /api/v1/* with read / write scopes — every endpoint ACL-filtered through the token owner. Full monitor CRUD via JSON — POST /sites creates any of the 7 monitor types, PATCH /sites/:id does partial updates, plus pause / resume / delete / check-now. Built-in /metrics Prometheus exporter for Grafana, also ACL-aware.
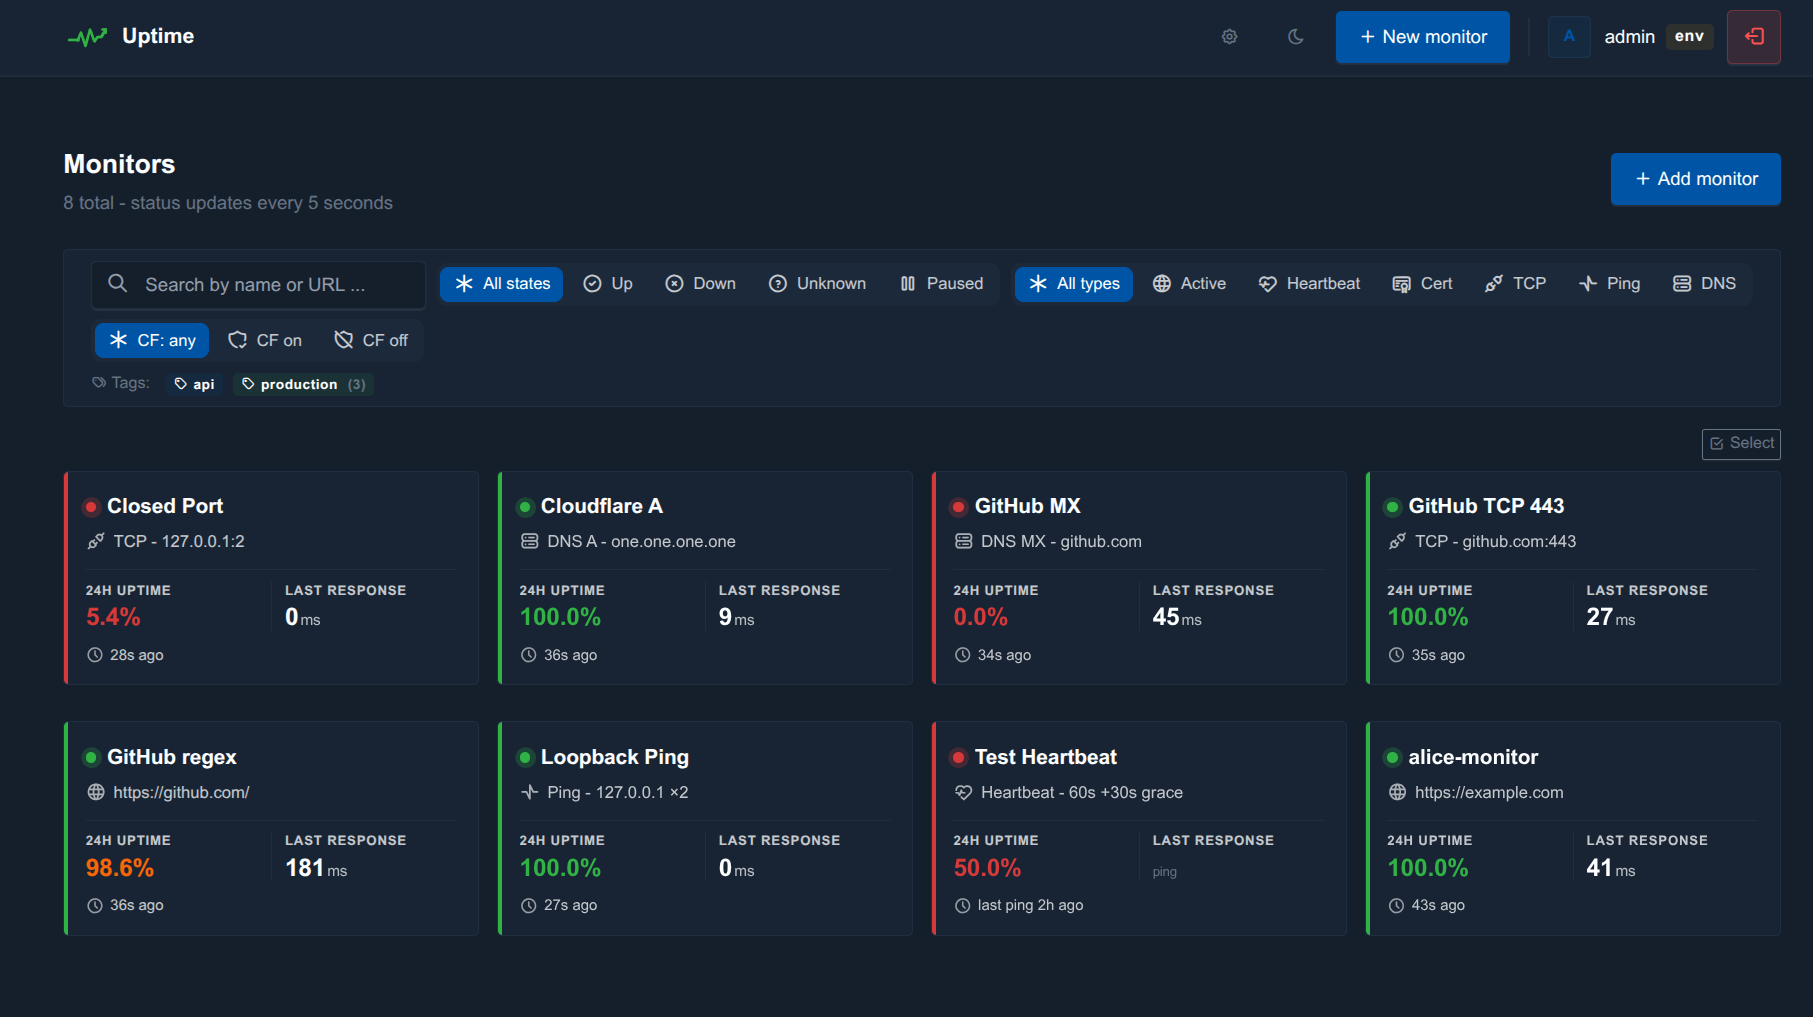
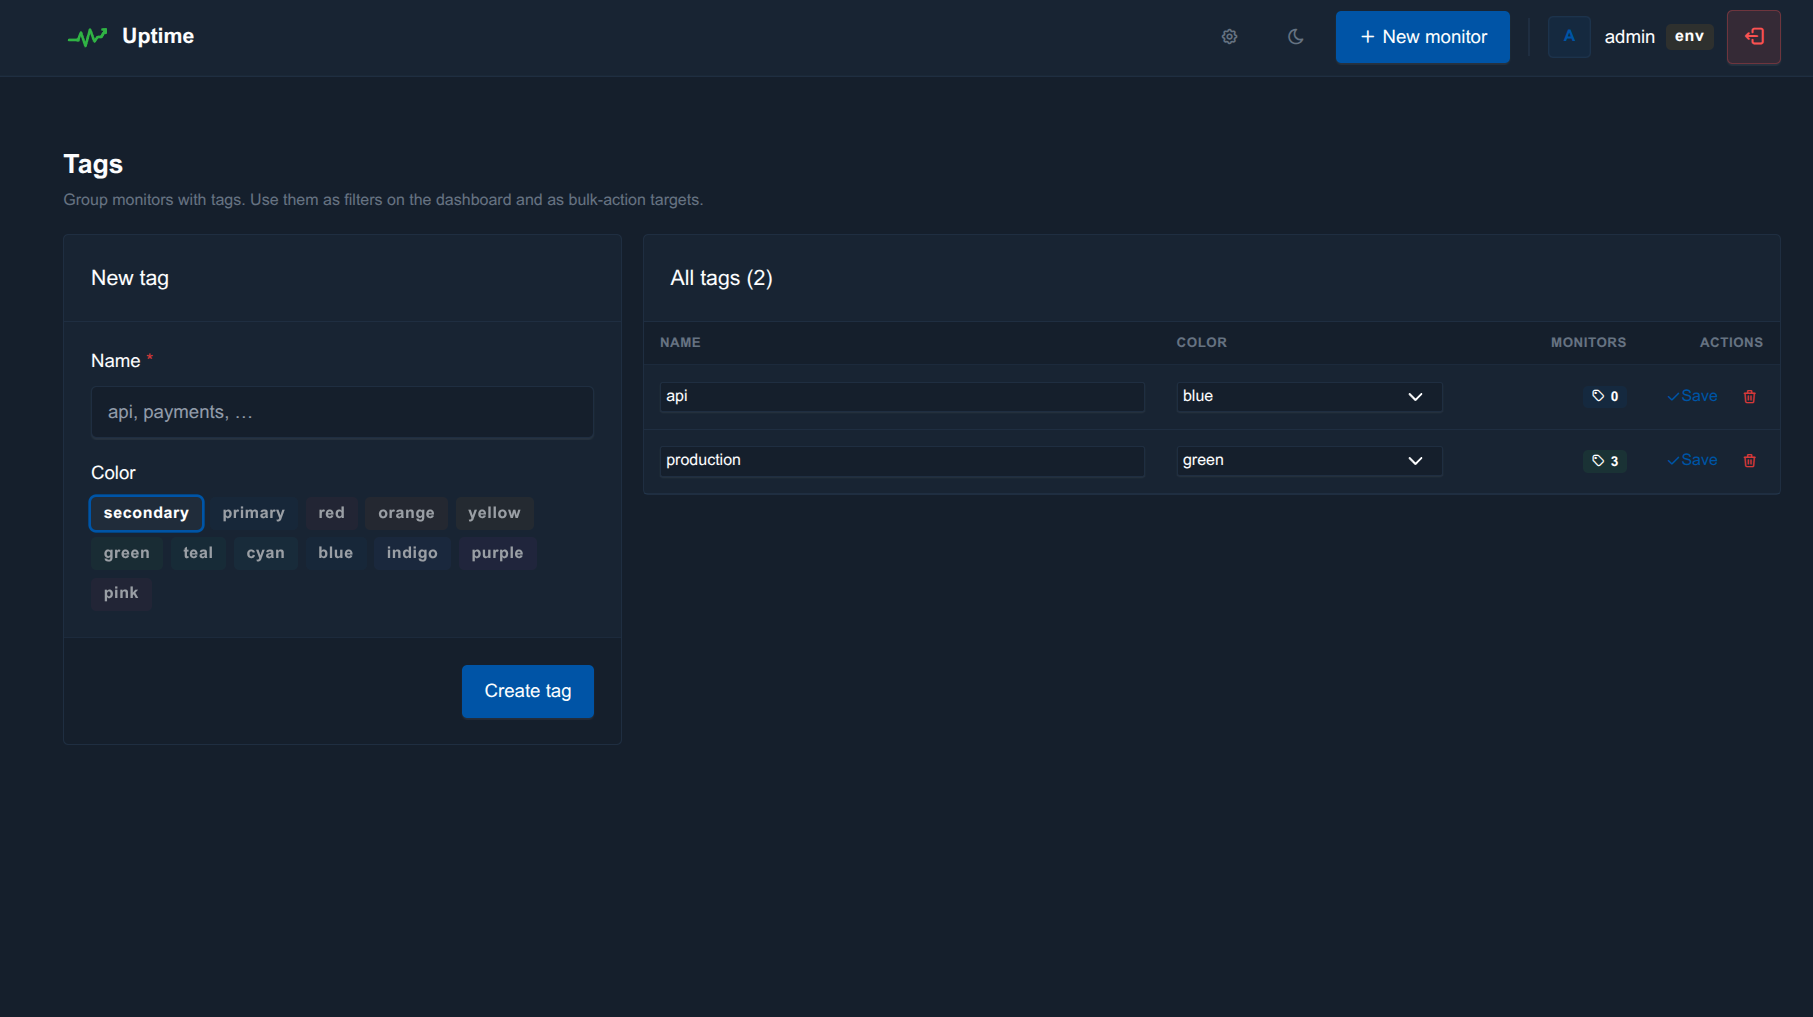
Coloured tag chips, multi-select bulk toolbar (pause / resume / delete / add-tag / remove-tag), server-side pagination, full-text search, and 5-second live polling of just the visible cards.
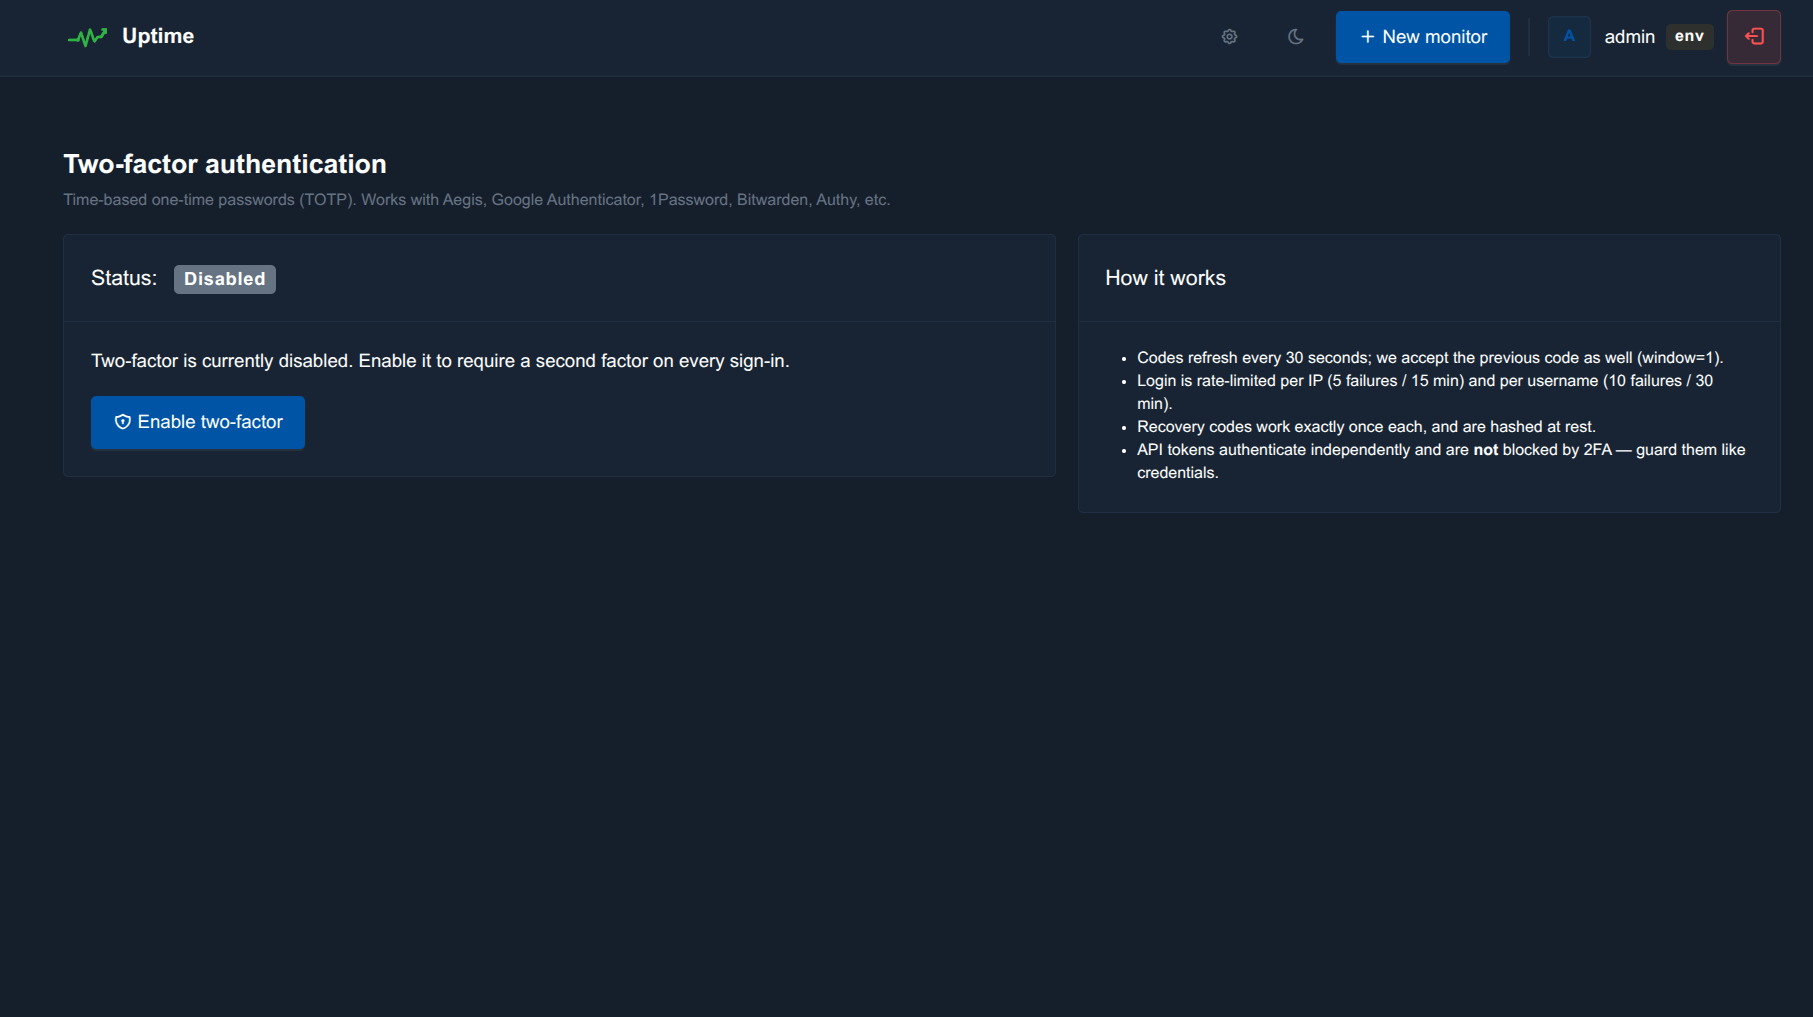
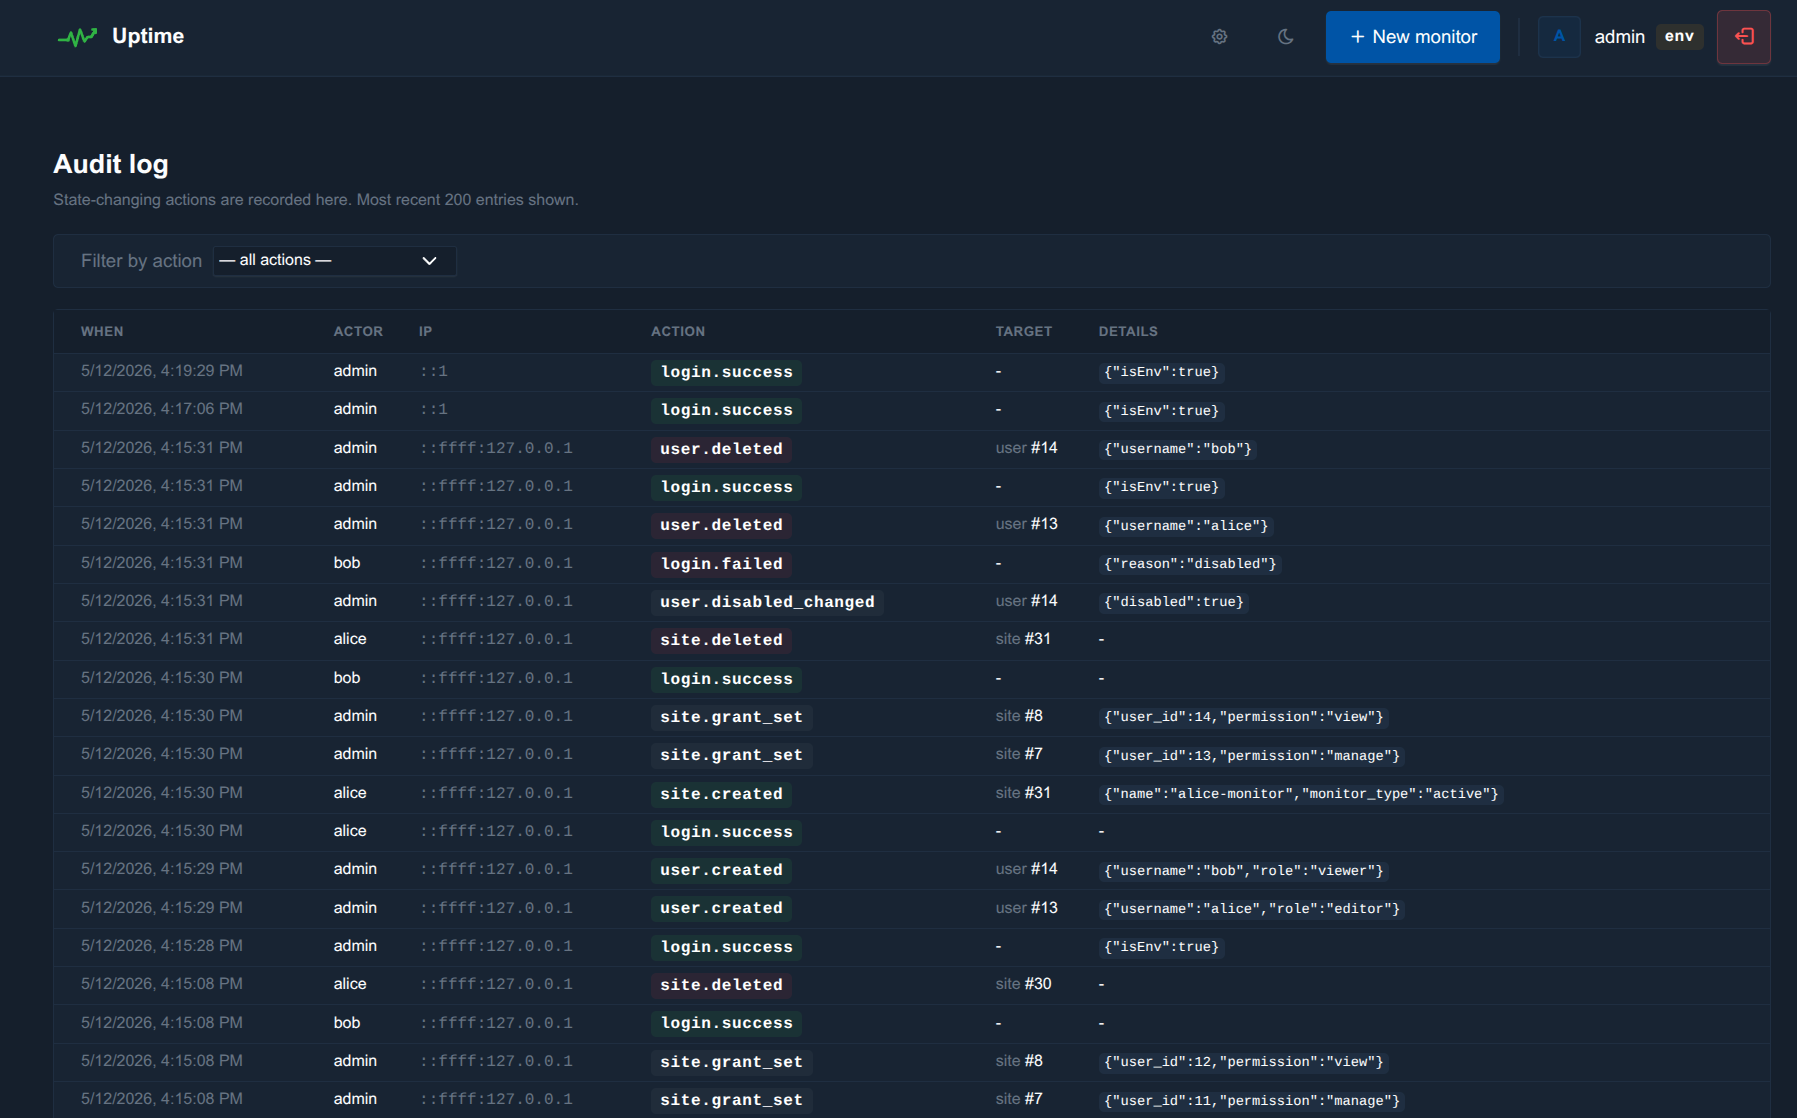
Per-user TOTP 2FA (RFC 6238) with 10 single-use recovery codes, in-memory rate-limit & lockout (5/15 min IP + 10/30 min username), full audit log per actor, and argon2id password hashing.
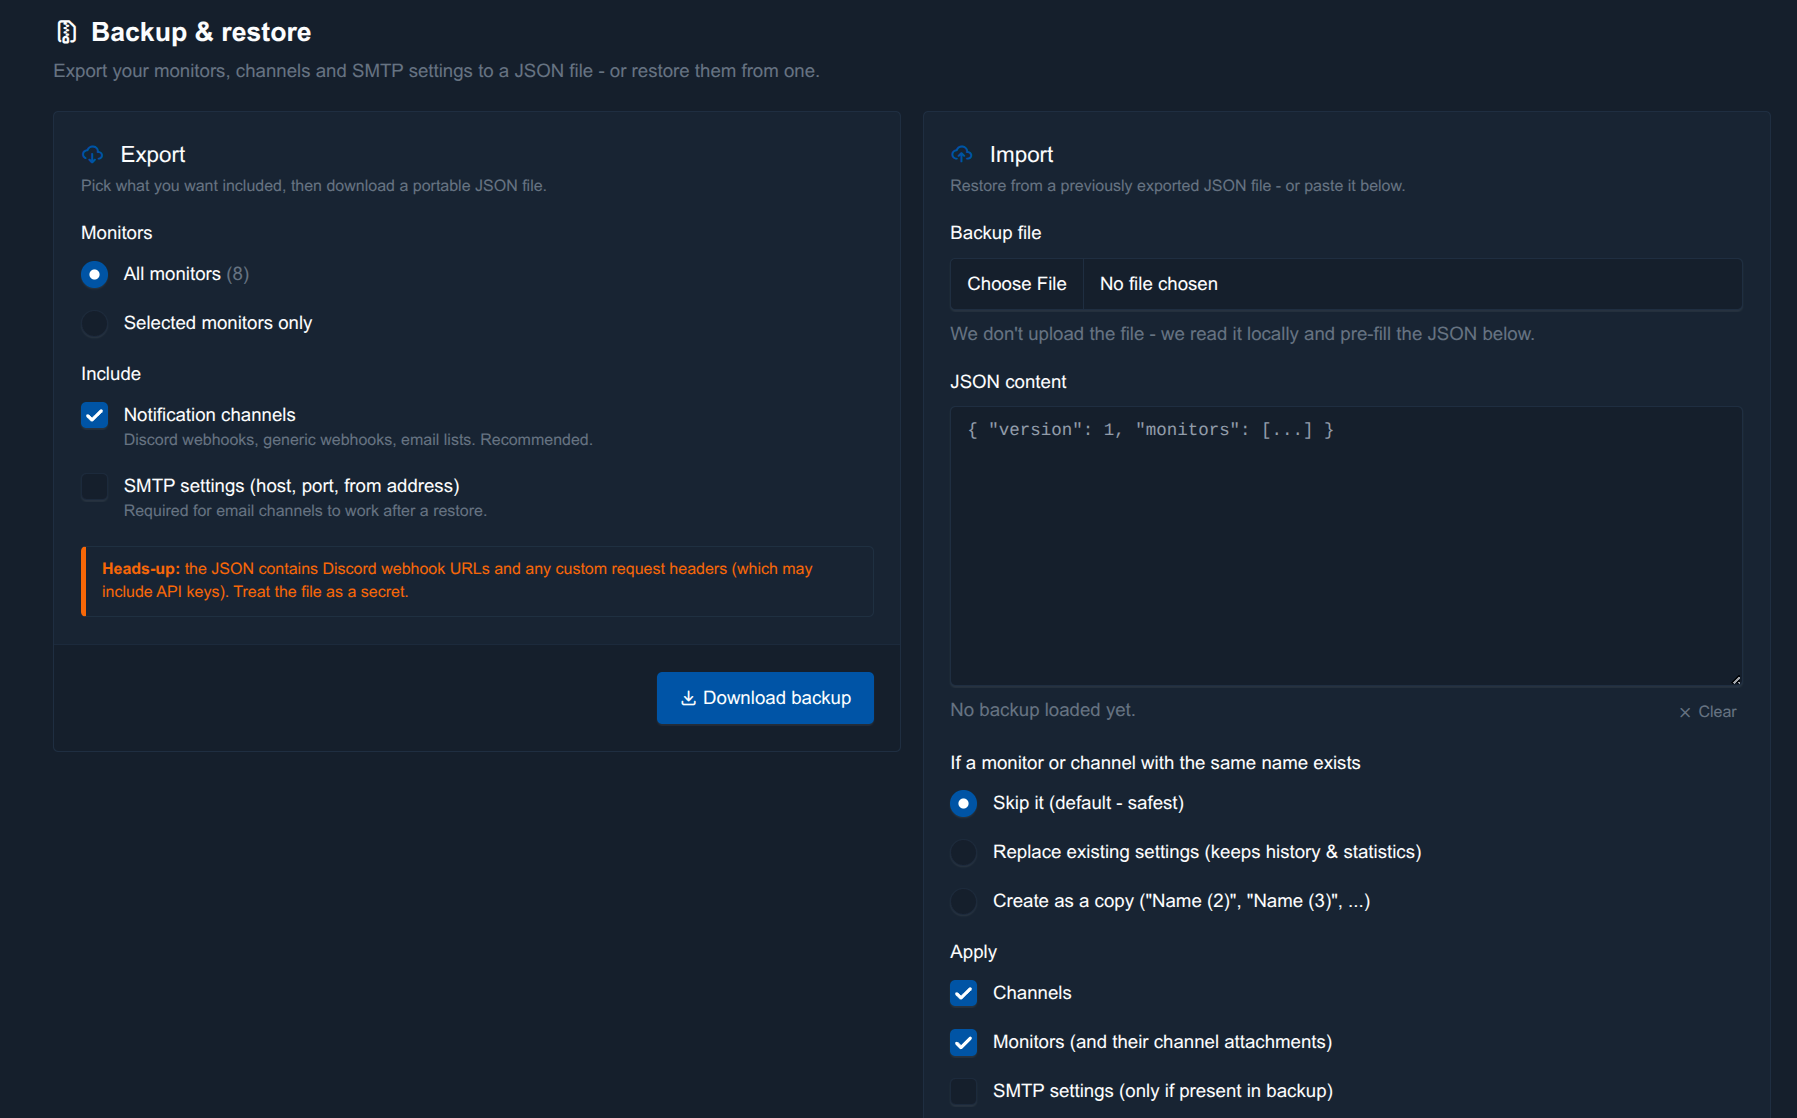
Export all or a selected subset of monitors, channels, and SMTP settings to a portable JSON file. Restore on another instance with a configurable conflict strategy (skip / replace / rename).
Honest list. Uptime is a mature space — but these are real, falsifiable differences that solve real on-call pain.
Detects Cloudflare challenges via status, cf-mitigated header, and body markers. Marks them as inconclusive so a JS challenge never tanks your uptime % or fires a false-positive alert. Adaptive exponential back-off, rotated browser UAs, optional per-monitor HEAD-first "Cloudflare mode".
during_maintenance flag on incidentsCompetitors silently suppress incidents during maintenance windows. We open the incident and flag it — so you can count "real" outages separately from ones you caused.
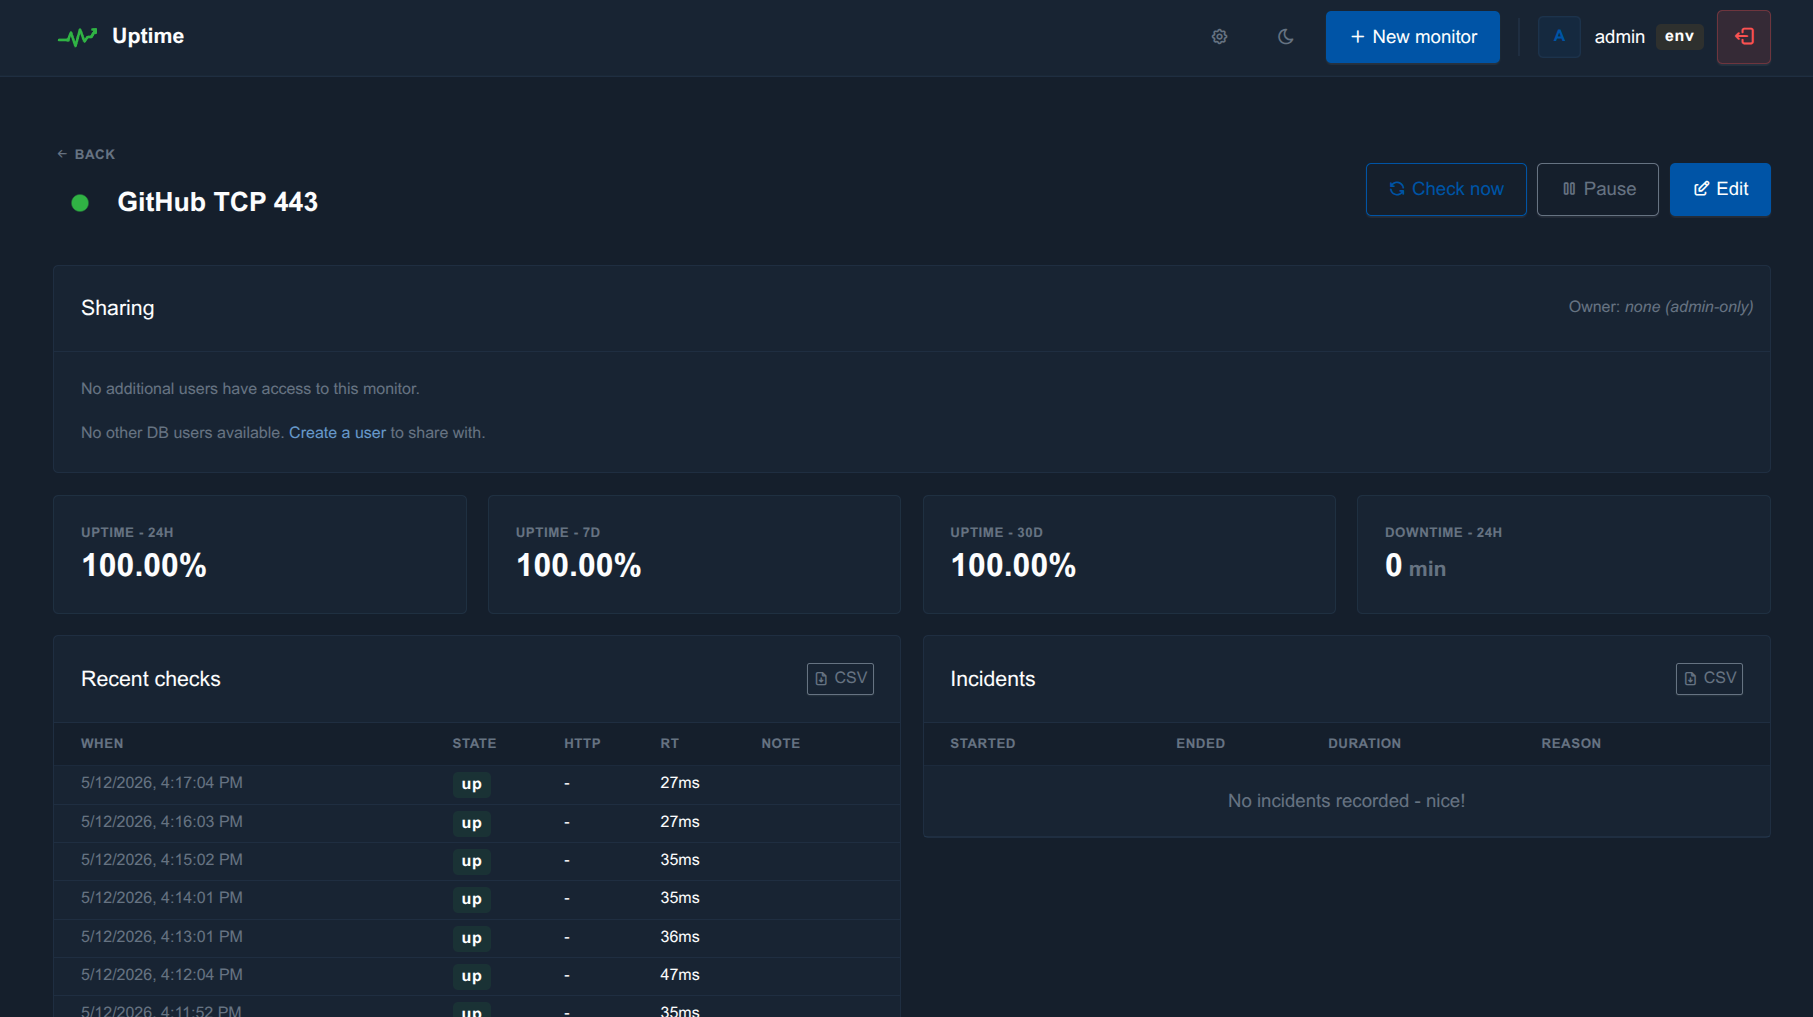
Keep the probes running and the history flowing, but suppress channel dispatches. Pause stops everything. Most monitors only have pause.
API tokens inherit the creator's monitor visibility. The Prometheus /metrics exporter respects that too. Most exporters are flat admin-or-nothing.
.env credentials stay as a permanent break-glass account, always admin, with its own TOTP secret. DB users have their own. You can never lock yourself out.
Clone, npm install, npm start. That's the prerequisite list. Docker is available if you want it; nothing about the project assumes it.
Catch a forgotten registrar renewal before the domain falls off the internet. The probe queries RDAP first via the IANA bootstrap registry (structured JSON), falls back to WHOIS over TCP/43 with multi-pattern parsing, stores expires_at / registrar / EPP status, and fires domain_expiring at 30/14/7/3/1/0-day bands — no nagging. Returns unknown for redacted TLDs instead of false-flagging DOWN. Uptime Kuma, Gatus, Statping, and Healthchecks all skip this.
When a probe fails, retry it once 2 seconds later before counting the failure. If the retry succeeds, the monitor stays UP and no alert fires — that single dropped TCP packet, DNS hiccup, or upstream blip never wakes you up. If the retry also fails, the failure flows through failure_threshold exactly as before. Per-monitor toggle, applies to every active probe type (HTTP / TCP / ping / DNS / cert / domain), invisible to the dashboard when it works. Same idea as Uptime Robot's "Confirmation" feature — Uptime Kuma, Gatus, Statping, and Healthchecks all skip this.
Outage alerts are easy to miss. Flip on re-notify for a monitor and the DOWN alert is re-sent on your chosen cadence (1 minute to 7 days) until it recovers. The schedule is tracked server-side in the DB, so it's restart-safe and self-throttling — and it works for passive heartbeats too, not just active probes.
Every monitor exposes public, shields.io-style badges at /badge/:id/status.svg and /badge/:id/uptime.svg — colour-graded, cache-friendly, no external service. Append ?hours=720 for a 30-day uptime window or ?label=API to rename one. The detail page hands you ready-to-paste Markdown. Drop your live uptime straight into a README.
Duplicate any monitor — every type-specific field, its notification channels, and its tags — in a single click. And JSON backup/restore now round-trips all seven monitor types (HTTP, heartbeat, TCP, ping, DNS, cert, domain) with every probe field intact, not just the basic two.
Clean, dark-by-default UI. Vanilla JS — no Bootstrap JS bundle, no SPA.
view or manage grants.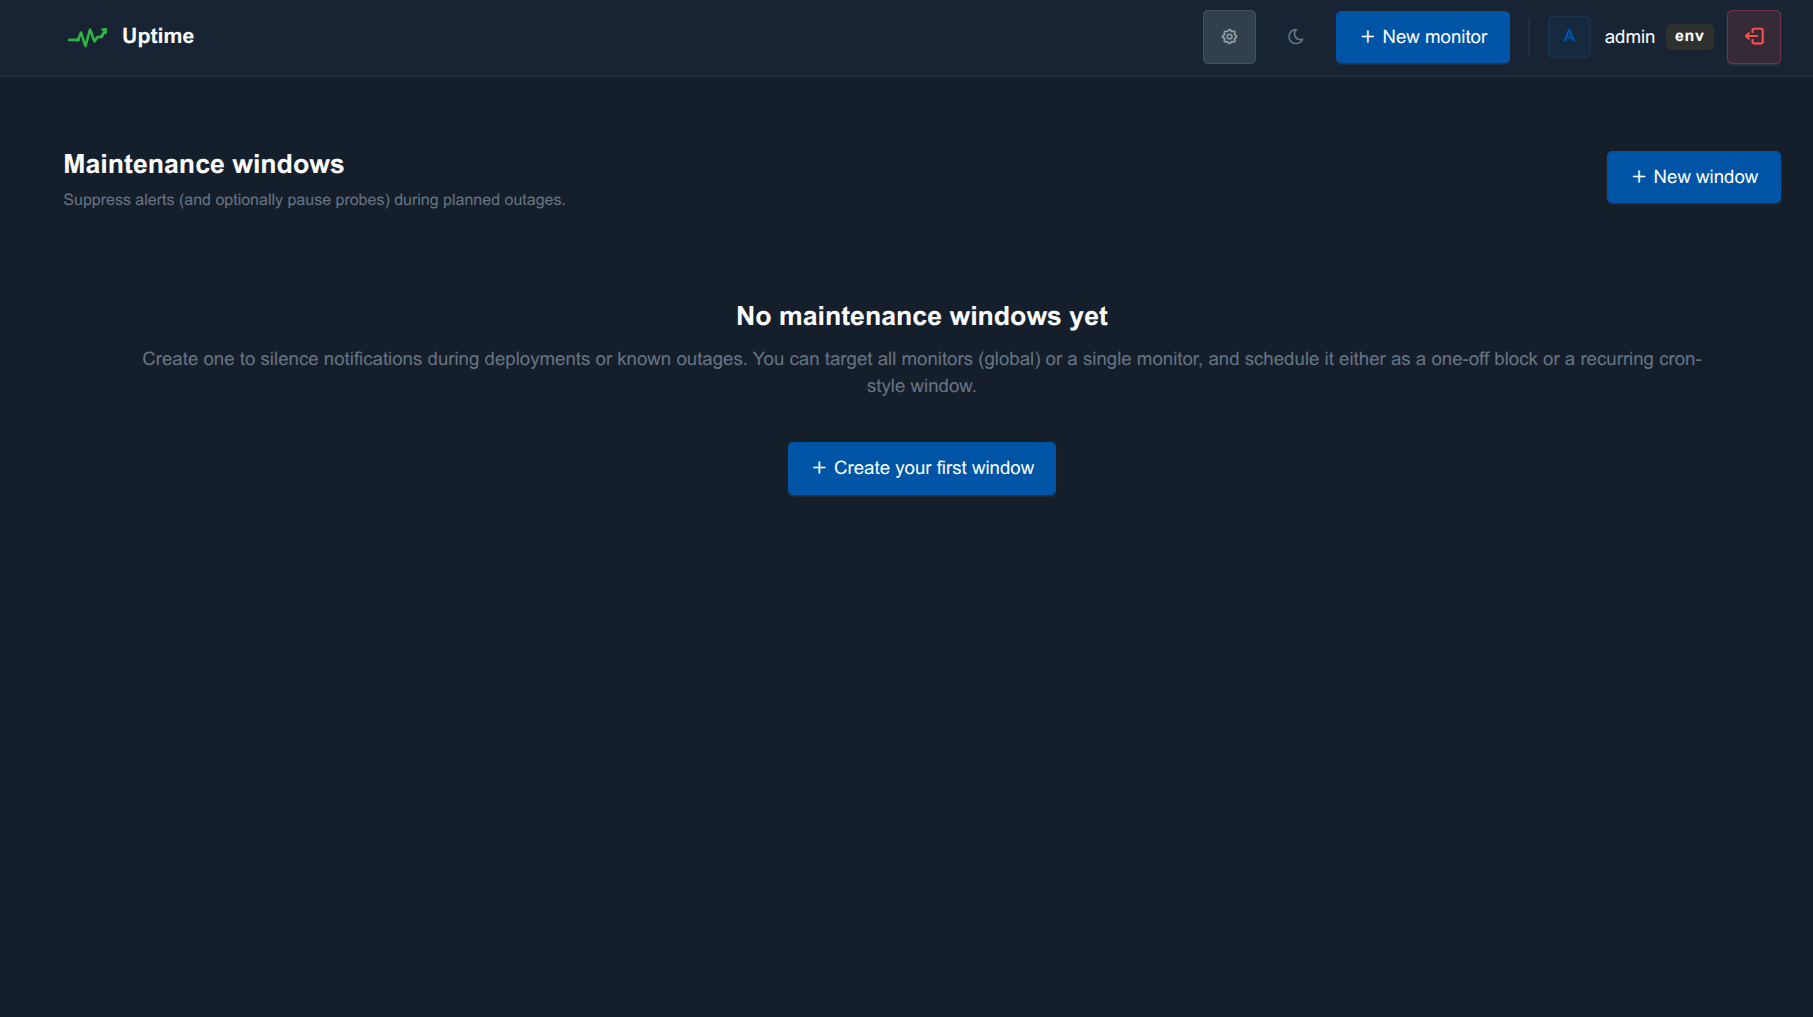
Picked carefully. We don't try to out-feature Uptime Kuma; we make a different trade-off.
| Uptime this | Uptime Kuma | Healthchecks.io | Gatus | Statping-ng | Better Stack | |
|---|---|---|---|---|---|---|
| License | MIT | MIT | BSD-3 | Apache-2 | Apache-2 | Proprietary |
| Self-hosted | Yes | Yes | Yes | Yes | Yes | No (SaaS) |
| Runs without Docker | Yes (1 process) | Yes | Yes | Yes | Yes | — |
| HTTP / TCP / Ping / DNS / Cert | All five | Most | HTTP only (passive) | Most | HTTP / TCP | All five |
| Domain WHOIS / RDAP expiry | Dedicated type (RDAP→WHOIS) | No | No | No | No | Basic |
| Heartbeats with cron + body capture | Yes | Basic | Best in class | No | No | Yes |
| Cloudflare-aware probing | Yes | No | No | No | No | — |
| Double-verify on failure (per monitor) | Yes (2s retry, all probe types) | No | No | No | No | Yes ("Confirmation") |
| Repeat / re-notify while down | Yes (toggle + interval) | Yes | No | No | No | Yes |
| Embeddable SVG status / uptime badges | Yes (public, per monitor) | No | Yes | No | No | Yes |
| Clone / duplicate a monitor | Yes (1 click) | No | No | No | No | Yes |
| Backup / restore (all monitor types) | Yes (all 7 types) | Yes | Yes | Config-as-code | Yes | No |
| Notification channels | 10 | 90+ | 30+ | Via shoutrrr | 13 | 20+ |
| Public status page + RSS | Yes | Yes | No | Yes | Yes | Yes |
| Multi-user with per-monitor ACLs | Yes | Coming | Teams only | No | Limited | Yes |
| REST API + Prometheus exporter | Both (ACL-filtered, full CRUD) | Limited | API only | Read-only | API only | API only |
| Audit log per actor | Yes | No | No | No | No | Yes |
| Login rate-limit + lockout | Yes | No | Yes | No | No | Yes |
| Dark mode by default | Yes | Yes | Yes | No | No | Yes |
| Footprint | ~150 MB · 1 process | ~100 MB | ~200 MB | ~30 MB | ~80 MB | — |
Compared as of May 2026 against publicly documented features. PRs welcome if anything's out of date.
Three minutes from git clone to a live dashboard.
git clone https://github.com/codewizdevs/uptime.git
cd uptime
npm install
cp .env.example .env.envSESSION_SECRET=$(openssl rand -hex 48)
ADMIN_USER=admin
ADMIN_PASS=<something strong>
DB_DRIVER=sqlite # or mysqlnpm start
# or for production
pm2 start src/server.js --name uptime
pm2 save
Open http://localhost:3000 and sign in. The schema auto-applies on first boot — no migration step. Need more? See the
PM2 + nginx
and
Docker
guides on GitHub.
Boring on purpose. Easy to read, easy to fork, easy to deploy.
undici (HTTP/2, brotli)better-sqlite3 or mysql2express-sessionargon2 (argon2id)nodemailerpino + rolling fileCodeWiz is a full-stack development agency specializing in custom web development, AI/ML integration, DevOps, and modern web technologies. We build, ship, and operate self-hosted infrastructure for small teams and bootstrapped products — and we open-source the parts we'd want to use ourselves.
Need this deployed for you, a custom integration, or a private fork with company-specific channels and SSO? Get in touch.